Real Estate
Sponsored by

July Housing Data Across Texas

2,500 Views | 16 Replies | Last: 4 yr ago by Red Pear Realty
Red Pear Realty
How long do you want to ignore this user?
Sponsor
AG
Houston

https://www.har.com/content/mls/?m=08&y=21


Quote:

By the numbers, Houston-area home sales were down this July compared to last. However, that is because COVID-related home closing delays during Q2 2020 finally pushed through that July as most of the pandemic lockdowns were lifted. The resulting surge of pent-up sales cemented July 2020 in the real estate history books as a record-setting month that could not be rivaled by the rapid-fire pace of the current market.

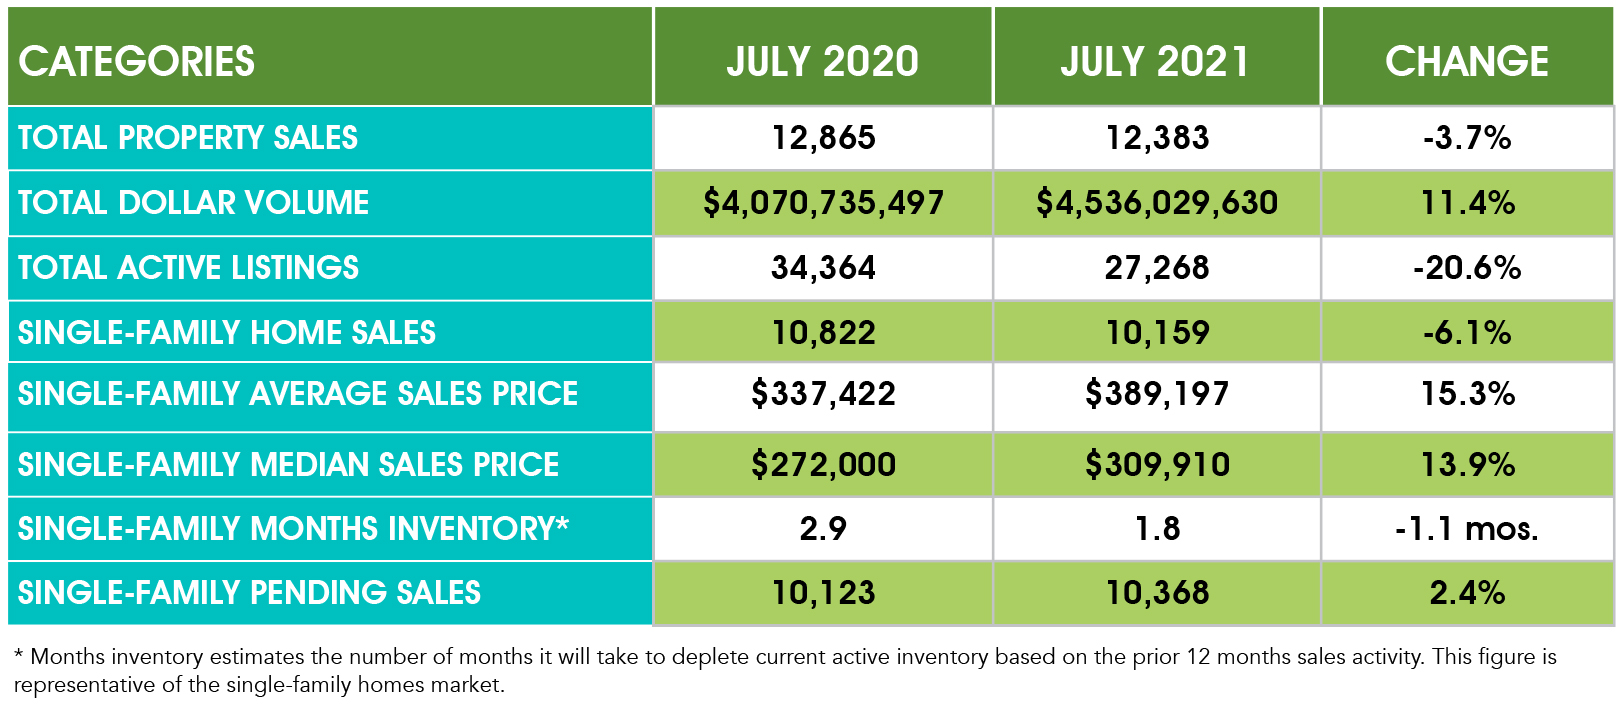
According to the Houston Association of Realtors (HAR) July 2021 Market Update, single-family homes sales were down 6.1 percent compared to last July, with 10,159 units sold versus the historic 10,822 that sold a year earlier. However, when compared to July 2019 an average month of home sales with volume totaling 8,921 the Houston housing market was up 13.9 percent. On a year-to-date basis, local home sales currently exceed 2020's record pace by 19.1 percent.

Once again, homes priced from $750,000 and above led the way in sales volume with a 36.7 percent year-over-year increase. That was followed by the $500,000 to $750,000 segment, which rose 18.9 percent. The single-family home average price increased 15.3 percent to $389,197 and the median price climbed 13.9 percent to $309,910. That marks the second highest pricing of all time behind last month's record-setting figures.

Sales of all property types fell 3.7 percent year-over-year, totaling 12,383. That is the third greatest volume of all time behind June 2021 (13,115) and July 2020 (12,865). Total dollar volume for the month rose 11.4 percent to $4.5 billion.

"We know anecdotally that the Houston real estate market is still red-hot, but the statistics make it appear to be slower than a year ago because of the surge in home closings that took place last July when the market began to normalize with the lifting of pandemic-related restrictions," said HAR Chairman Richard Miranda with Keller Williams Platinum. "Assertive investors and cash buyers are still controlling the tides of this seller's market, but hopefully that will moderate with a continued influx of new listings."
Sponsor Message: We Split Commissions. Full Service Agents in Austin, Bryan-College Station, Dallas-Fort Worth, Houston and San Antonio. Red Pear Realty
Red Pear Realty
How long do you want to ignore this user?
Sponsor
AG
Bryan - College Station

https://www.bcsrealtor.com/index.php?submenu=areaHousingStatistics&src=gendocs&ref=AreaHousingStatistics&category=forConsumers


Sponsor Message: We Split Commissions. Full Service Agents in Austin, Bryan-College Station, Dallas-Fort Worth, Houston and San Antonio. Red Pear Realty
Red Pear Realty
How long do you want to ignore this user?
Sponsor
AG
Tyler


https://dds.terradatum.com/public/market-area-trends/greater-tyler-association-of-realtors/MTEvMjE=/?search=normal&areaType=ALL&areaValueList=&timePeriod=mth&timePeriodValue=37&propertyClassList=ALL&search_enable_flag=MQ==
Sponsor Message: We Split Commissions. Full Service Agents in Austin, Bryan-College Station, Dallas-Fort Worth, Houston and San Antonio. Red Pear Realty
Red Pear Luke
How long do you want to ignore this user?
Sponsor
AG
All of North Texas


Dallas County


Collin County


Tarrant County


Interesting Articles:

Sponsor Message: We Split Commissions. Full Service Agents in Austin, Bryan-College Station, Dallas-Fort Worth, Houston and San Antonio. Red Pear Realty
K_P
How long do you want to ignore this user?
AG
Do you see it starting to turn around? I feel like I'm starting to see more price reductions, but maybe that's my own wishful thinking.
Red Pear Luke
How long do you want to ignore this user?
Sponsor
AG
K_P said:

Do you see it starting to turn around? I feel like I'm starting to see more price reductions, but maybe that's my own wishful thinking.
I think we are seeing pricing reductions, but that can probably be attributed to houses pricing much too high to begin with. We are also right on the cusp of back to school - so the demand is dropping cause there aren't as many people moving.

Some properties though are still seeing multiple offers and getting locked up within a few days of listing. I think we will still see an overall increasing trend, but just not as much of the pace we've been going on lately with some high MoM % gains. So I guess that could technically be construed as a turn around?
Sponsor Message: We Split Commissions. Full Service Agents in Austin, Bryan-College Station, Dallas-Fort Worth, Houston and San Antonio. Red Pear Realty
Tastybrisket10
How long do you want to ignore this user?
AG
North Texas...ugh.
Red Pear Luke
How long do you want to ignore this user?
Sponsor
AG
Tastybrisket10 said:

North Texas...ugh.


Very painful to see it and be explaining it to folks just how crazy the price appreciation has been moving.
Sponsor Message: We Split Commissions. Full Service Agents in Austin, Bryan-College Station, Dallas-Fort Worth, Houston and San Antonio. Red Pear Realty
mazag08
How long do you want to ignore this user?
AG
I'll try and piece together all 7 months of data we have for Houston in 2021 so we can see the month over month changes instead of comparing to the same month in 2020. Probably get to it Sunday night.
jac4
How long do you want to ignore this user?
AG
I know these are generalized, but are these numbers based on the dates of going under contract or the date of closing?

My own house would contradict the Bryan infographic.
Red Pear Realty
How long do you want to ignore this user?
Sponsor
AG
jac4 said:

I know these are generalized, but are these numbers based on the dates of going under contract or the date of closing?

My own house would contradict the Bryan infographic.


Days on market is the time between the listing being published and contract being signed. Days to close is the time between contract execution and closing. Every situation is different, but remember that many homes right now are getting listed on a Thursday and under contract by Monday. The market is that hot.
Sponsor Message: We Split Commissions. Full Service Agents in Austin, Bryan-College Station, Dallas-Fort Worth, Houston and San Antonio. Red Pear Realty
jac4
How long do you want to ignore this user?
AG
Red Pear Realty said:

jac4 said:

I know these are generalized, but are these numbers based on the dates of going under contract or the date of closing?

My own house would contradict the Bryan infographic.


Days on market is the time between the listing being published and contract being signed. Days to close is the time between contract execution and closing. Every situation is different, but remember that many homes right now are getting listed on a Thursday and under contract by Monday. The market is that hot.
I meant price distribution. Is it based on closing date or date going under contract? Because I closed in July and I know how much we paid for the house and that it is in Bryan.
Red Pear Realty
How long do you want to ignore this user?
Sponsor
AG
Are you saying you bought a house in July for between $750,000 and $1m?
Sponsor Message: We Split Commissions. Full Service Agents in Austin, Bryan-College Station, Dallas-Fort Worth, Houston and San Antonio. Red Pear Realty
jac4
How long do you want to ignore this user?
AG
Maybe.

If that is off, then can I trust the rest of the numbers?
Red Pear Realty
How long do you want to ignore this user?
Sponsor
AG
All of this data is sourced from market participants as they enter info into the MLS. Garbage in, garbage out. People are human and make errors sometimes. Agents also selectively enter data (or forget to enter data) sometimes because the data doesn't make them look good or help the market. Builders are notorious for not entering comps.

So yes, while one piece of data might be incorrect, across Texas, the data is pretty good and paints a pretty good picture of where the market is. You should email the graphic to your agent and ask about it.
Sponsor Message: We Split Commissions. Full Service Agents in Austin, Bryan-College Station, Dallas-Fort Worth, Houston and San Antonio. Red Pear Realty
La Bamba
How long do you want to ignore this user?
AG
Red Pear, how/where could I get similar data on other areas in Texas? Say the Golden Triangle?
Red Pear Realty
How long do you want to ignore this user?
Sponsor
AG
The Texas A&M Real Estate Center publishes a ton of great data regularly at the link below. I've only done one deal in Beaumont, but if I start doing more business there I'll start tracking that market here as well.

https://www.recenter.tamu.edu/research/housing-reports
Sponsor Message: We Split Commissions. Full Service Agents in Austin, Bryan-College Station, Dallas-Fort Worth, Houston and San Antonio. Red Pear Realty
Red Pear Realty
How long do you want to ignore this user?
Sponsor
AG
San Antonio

https://member.sabor.com/wp-content/uploads/2021/08/July-Market-Report.pdf


Sponsor Message: We Split Commissions. Full Service Agents in Austin, Bryan-College Station, Dallas-Fort Worth, Houston and San Antonio. Red Pear Realty
Refresh
Page 1 of 1
 
×
subscribe Verify your student status
See Subscription Benefits
Trial only available to users who have never subscribed or participated in a previous trial.