COVID Dashboard with True Infections and Implied IFR Over Time

1,851 Views | 14 Replies | Last: 5 yr ago by Mr President Elect
HotardAg07
How long do you want to ignore this user?
AG
All,
I have been unhappy with the different ways that the data is presented on coronavirus after Youyang Gu stopped updating his model. I wanted someone to not just present cases, but also true infections. I wanted someone not to report deaths but IFR.

I went ahead and did the work myself, based on Youyang Gu's methodologies for estimating true infections, which has been pretty good and approximated by other epidemiologists:


I hope you guys find it useful, interesting.

Notes:
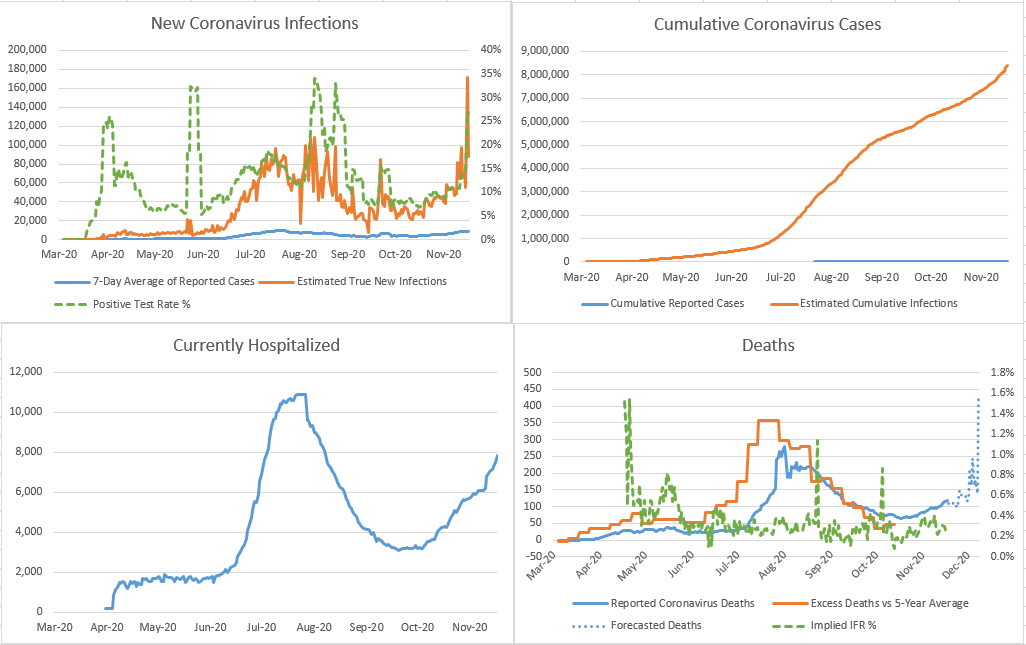
1. True infections estimated by Youyang Gu's methodology
https://covid19-projections.com/estimating-true-infections/

2. Rest of reported case, hospitalization, death data from COVID tracking project

3. Excess mortality data from CDC. I subtracted the excess mortality of this year versus the average of the last 5 years in order to calculate the excess mortality.
https://gis.cdc.gov/grasp/fluview/mortality.html

4. Updated excess mortality graph below. The different shades indicate different times I have updated this graph and published to Texags.


5. I used a 22 day delay to calculate implied IFR, consistent with what I've seen epidemiologists like Trevor Bedford discuss.

6. I used reported, not excess deaths for the ifr calculation.

7. Forecasted deaths just uses that 22 day delay from infections and projects forward deaths based on 0.25% ifr
ORAggieFan
How long do you want to ignore this user?
Interesting stuff and love it. One question though. With deaths highest in April, why not infections the highest at that point (or around then)?

I could think of a few reasons. Better at managing patients now due to what we've learned or population age/susceptibility. Curious others thoughts as other similar graphs I've seen estimate infections the highest back in April.
HotardAg07
How long do you want to ignore this user?
AG
ORAggieFan said:

Interesting stuff and love it. One question though. With deaths highest in April, why not infections the highest at that point (or around then)?

I could think of a few reasons. Better at managing patients now due to what we've learned or population age/susceptibility. Curious others thoughts as other similar graphs I've seen estimate infections the highest back in April.
the IFR was much higher back then. I've tried to graph IFR over time in my deaths graph and you can see it was at least triple, probably more so.

As for why the IFR was so much higher, my guess is that we have learned treatments and techniques that have improved outcomes and also we've understood which things to avoid. Back in March, early intubation was a thing and NY was making some pretty big policy mistakes with regards to treatment of elderly and long term care.

What I find a little alarming is that IFR has seemed to flatten out and if this spike in infections is as bad as it seems, then we will be getting new daily highs in daily deaths in the next few weeks.

I'll try to make the same dashboard for Texas. I think it paints a rosier picture.
PJYoung
How long do you want to ignore this user?
AG
Appreciate your effort
waitwhat?
How long do you want to ignore this user?
Is it actually accepted as likely that the number of true infections is 8-10x greater than the reported daily infections?
" 'People that read with pictures think that it's simply about a mask' - Dana Loesch" - Ban Cow Gas

"Truth is treason in the empire of lies." - Dr. Ron Paul

Big Tech IS the empire of lies

TEXIT
HotardAg07
How long do you want to ignore this user?
AG
Texas

HotardAg07
How long do you want to ignore this user?
AG
waitwhat? said:

Is it actually accepted as likely that the number of true infections is 8-10x greater than the reported daily infections?
I do not think there is universal acceptance of any fact anymore, but the scientific community seems to understand this idea very well considering the number of large serological studies that have been done in hot spots such as NYC or Italy.
CDub06
How long do you want to ignore this user?
AG
Super interesting stats. Thanks for your effort and for sharing.
waitwhat?
How long do you want to ignore this user?
HotardAg07 said:

waitwhat? said:

Is it actually accepted as likely that the number of true infections is 8-10x greater than the reported daily infections?
I do not think there is universal acceptance of any fact anymore, but the scientific community seems to understand this idea very well considering the number of large serological studies that have been done in hot spots such as NYC or Italy.
Well there's no question the true rate is higher than the daily reported rate, but I figured it was closer to 5x higher, not 8-10x higher.
" 'People that read with pictures think that it's simply about a mask' - Dana Loesch" - Ban Cow Gas

"Truth is treason in the empire of lies." - Dr. Ron Paul

Big Tech IS the empire of lies

TEXIT
Cepe
How long do you want to ignore this user?
AG
Very interesting, Thanks!
CDub06
How long do you want to ignore this user?
AG
FYI your Cumulative Reported Cases in the Texas graphic is broken.
HotardAg07
How long do you want to ignore this user?
AG
CDub06 said:

FYI your Cumulative Reported Cases in the Texas graphic is broken.
I need to do something about the texas data. I think it's struggling with all the data dumps.
HotardAg07
How long do you want to ignore this user?
AG
Fixed

looks like 25-30% ish prevalence so far.
Fitch
How long do you want to ignore this user?
AG
Very nicely done. It's been a pet peeve of mine trying to reconcile current cases to the March/April wave when testing was so handicapped.
HotardAg07
How long do you want to ignore this user?
AG
LOL if I just waited one effing day I could have saved myself the work

Mr President Elect
How long do you want to ignore this user?
AG
I would assume the coefficients used to estimate the number of infections should be directly correlated to the number of daily tests performed. At the beginning we were only testing the sick and vulnerable, and I thought the 10x came from that. Now nearly anyone can get a test as well as certain industries are doing testing on people whether they are sick or not, so that would seemingly reduce that 10x greatly. With all that being said, the source for calculating the estimated number of infections was tldr; so I apologize if that was covered.
Refresh
Page 1 of 1
 
×
subscribe Verify your student status
See Subscription Benefits
Trial only available to users who have never subscribed or participated in a previous trial.