
Have there been more total deaths this year than last year? I'm trying to figure out if covid has risen total deaths in US this year
Post Reply
1 of 1
2019 vs 2020 deaths in US
4,052 Views |
24 Replies |
Last: 5 yr ago by JDL 96
This is the Financial Times' attempt to answer the question of excess mortality against historical averages:
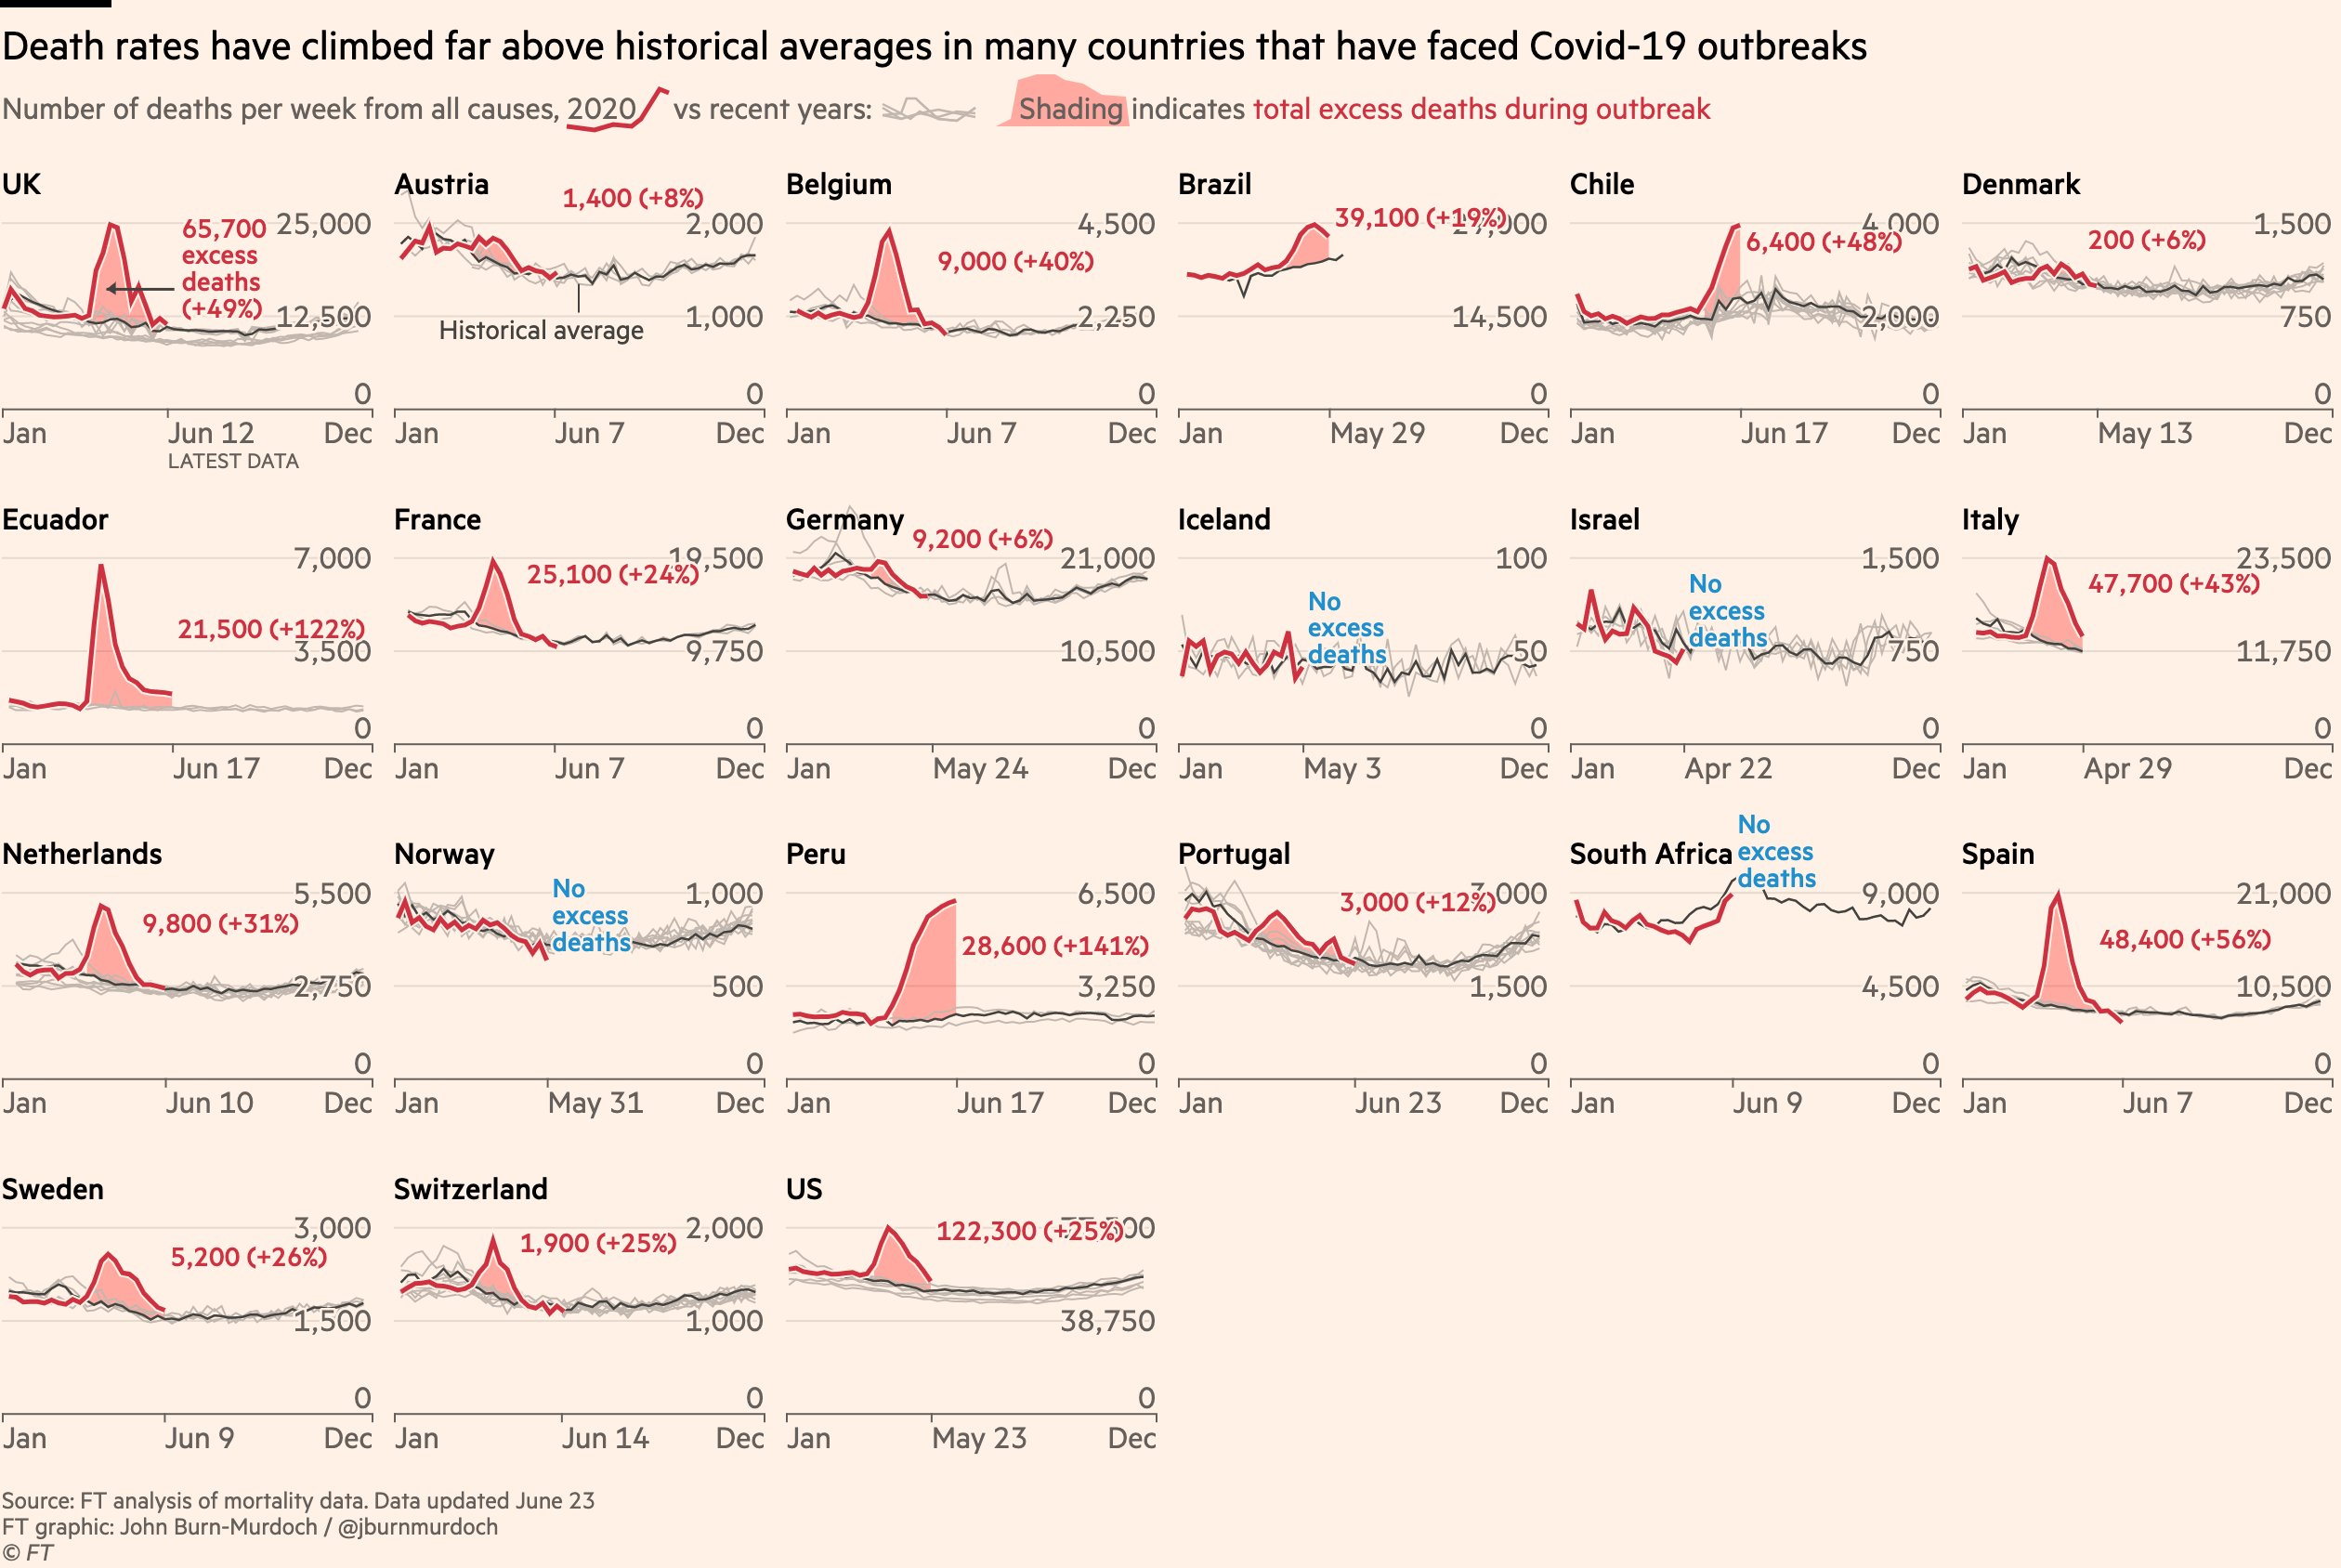

The sourcing for the data is all public and referenced below
https://www.ft.com/content/a26fbf7e-48f8-11ea-aeb3-955839e06441
The sourcing for the data is all public and referenced below
https://www.ft.com/content/a26fbf7e-48f8-11ea-aeb3-955839e06441
Has there been considerably more total deaths in US this year compared to last year?
The answer is we don't know. That FT piece also has some data (but i think it's a month old) on excess deaths per capita and as a %. It should the US was doing very well compared to the rest of Europe in those metrics.
I'd like to find total us deaths January - June 2019 and compare that to total us deaths January - June 2020
I wouldn't be surprised if there were more total deaths in that time period of 2019 compared to 2020
I wouldn't be surprised if there were more total deaths in that time period of 2019 compared to 2020
I don't think you'll find that data for a while, but I think you'll be wrong in your guess. However the degree to which there is extra won't be as staggering as many think.
This is at least trying to look at the right thing.
Once we start trending with the historical line (when the red line meets the black line), shouldn't we try to get back to normal?
Once we start trending with the historical line (when the red line meets the black line), shouldn't we try to get back to normal?
In Texas the total deaths were higher in 2019 from January - May than in 2020
There must be somewhere that tracks monthly total deaths in this country and then we could compare to last year
There must be somewhere that tracks monthly total deaths in this country and then we could compare to last year
I dug into the data that the financial times used from the National Center for Health Statistics in the US. For the graph above they were using data from 2013-2020, however I pulled the data for just 2019 and 2020.
For weeks 1-21 in 2020 1,298,231 people have died
For weeks 1-21 in 2019 1,188,610 people died.
+~110,000 in 2020 vs 2019 or roughly 10%. The data is not available after week 21 (roughly May 23d)
For weeks 1-21 in 2020 1,298,231 people have died
For weeks 1-21 in 2019 1,188,610 people died.
+~110,000 in 2020 vs 2019 or roughly 10%. The data is not available after week 21 (roughly May 23d)
I wonder what 2018 looks like for that time period? Did 2019 have about 100,000 more deaths than 2018 in this time period?
1,207,187 for weeks 1-21 in 2018.
If you want to dig into this data yourslef, just go to this website. You can slice the data up and download it as a csv and import it to excel to analyze it.
https://gis.cdc.gov/grasp/fluview/mortality.html
The graphic shows flu and pnuemonia deaths but the raw data you download shows all deaths.
I'm sorry, but basically any way you slice the data, the US has had a surplus of deaths in the ~10% range in 2020 versus previous years.
https://gis.cdc.gov/grasp/fluview/mortality.html
The graphic shows flu and pnuemonia deaths but the raw data you download shows all deaths.
I'm sorry, but basically any way you slice the data, the US has had a surplus of deaths in the ~10% range in 2020 versus previous years.
Which would be expected with a pandemic, I would think that 10% increase of death is on the low end of most guesses of a pandemic affect on the US.
Not saying it is good or bad but on the whole if we finish this year with only 10% increase in mortality rate I would say that is not too bad.
Not saying it is good or bad but on the whole if we finish this year with only 10% increase in mortality rate I would say that is not too bad.
Easy come, Easy go
Certainly better than being in the UK.
Total deaths isn't a great number in my opinion, because the measures taken to prevent Covid also prevent other forms of death. Couple examples:
We had a period of time where people were driving very little, and even now many are still driving less, so there's lots fewer auto accidents... to the point that insurance companies are giving rebates.
The folks who are vulnerable to Covid would also be vulnerable to pneumonia/flu deaths, so if they're protecting themselves from Covid, they're also protecting themselves from those.
A study was actually just published on this
https://www.sciencedaily.com/releases/2020/07/200701125506.htm
https://jamanetwork.com/journals/jama/fullarticle/2768086
https://www.sciencedaily.com/releases/2020/07/200701125506.htm
https://jamanetwork.com/journals/jama/fullarticle/2768086
Quote:
Researchers at Virginia Commonwealth University and Yale University found that, from March 1 to April 25, the U.S. saw 87,001 excess deaths -- or deaths above the number that would be expected based on averages from the previous five years.
The study, "Excess Deaths from COVID-19 and Other Causes, March-April 2020," showed that only 65% of the excess deaths that occurred in March and April were attributed to COVID-19, meaning more than one-third were linked to other causes.
Quote:
Woolf and his team found that deaths from causes other than COVID-19 rose sharply in the states that had the most COVID-19 deaths in March and April. Those states were Massachusetts, Michigan, New Jersey, New York -- particularly New York City -- and Pennsylvania. At COVID-19's peak for March and April (the week ending April 11), diabetes deaths in those five states rose 96% above the expected number of deaths when compared to the weekly averages in January and February of 2020. Deaths from heart disease (89%), Alzheimer's disease (64%) and stroke (35%) in those states also spiked.
New York City's death rates alone rose a staggering 398% from heart disease and 356% from diabetes, the study stated.
Quote:
"We can't forget about mental health," Woolf said. "A number of people struggling with depression, addiction and very difficult economic conditions caused by lockdowns may have become increasingly desperate, and some may have died by suicide. People addicted to opioids and other drugs may have overdosed. All told, what we're seeing is a death count well beyond what we would normally expect for this time of year, and it's only partially explained by COVID-19."
Woolf, also a family physician, said this paper's results underscore the need for health systems and public officials to make sure services are available not only for COVID-19 but for other health problems. His study showed what happened in the states that were overwhelmed by cases in March and April. Woolf worries that the same spikes in excess deaths may now be occurring in other states that are being overwhelmed.
Great stuff
Check the table that includes "percent of expected deaths" at .https://www.cdc.gov/nchs/nvss/vsrr/covid19/index.htm I think this has what you are looking for, although unclear how they calculate "expected".


As of normalized week 36 (week 23 of following year), the 2019-2020 death count is 6.1% higher than 2018-2019 and 9.3% higher than 2013-2019 average.
What can be seen in that first chart is that COVID "season" is effectively over. We're back to normal death levels.
Perhaps a bit oversimplified. If the most recent week shown in the chart for 2020 is fully caught up on reported deaths, which it wouldn't be if that last week depicted would fall in the past 3 weeks, it would mean that total deaths are within historical, yes. But could be down in areas that are reduced by people not driving as much, etc but still up in Covid. Not saying it isn't caught up, or that Covid is contributing in a statistically significant way at this point, but that chart alone doesnt prove a COVID season is over. I also want to make sure in the next couple weeks that deaths attributed to Covid don't increase again before declaring the season over.Keegan99 said:
What can be seen in that first chart is that COVID "season" is effectively over. We're back to normal death levels.
This won't be of much value, since I can't find the link right now, but this morning I read an article about a Yale study that had deaths up about 20-25% so far this year. It attributed most of the increase to an increase in flu like deaths. However, it didn't really go much into detail, and I would like to know if there was any increase in deaths from people not being able to get services with all the hospitals focused on Covid.
I linked this study above
"As of normalized week 36 (week 23 of following year), the 2019-2020 death count is 6.1% higher than 2018-2019 and 9.3% higher than 2013-2019 average."
Not even close to 25% so something is off with the Harvard study
Not even close to 25% so something is off with the Harvard study
For the shutdown to have been justified, it should be obvious to everyone that lots of people are dying and getting sick. It shouldn't take all these charts,etc etc.
Featured Stories
See All
McMillan makes SEC Tourney debut on Thursday
by Olin Buchanan
8:02
9h ago
981
TexAgs On-Site: Music City Madness is already underway
by Luke Evangelist
Scouting Report: #6 Texas A&M vs. #11 Oklahoma (SEC Tournament)
by Tom Schuberth
Five A&M recruiting storylines to following this spring
by Ryan Brauninger
20:40
18h ago
3.5k